Bitcoin’s price has struggled to regain strength since late October, with multiple failed recovery attempts extending its decline. The leading cryptocurrency has been oscillating near critical support levels as on-chain indicators reveal emerging signs of weakness. Rising volatility and a lack of directional conviction continue to define market behavior. Bitcoin May Face Resistance The Short-Term Holder to Long-Term Holder (STH/LTH) Supply Ratio recently rose to 18.3%, exceeding the upper band of 17.9%. This signals elevated speculative activity as short-term traders dominate market movements. Increased turnover without sustained price direction has led to heightened volatility in Bitcoin’s trading environment. The surge in this ratio also suggests that traders are quickly shifting between profit-taking and accumulation phases. As a result, market churn has intensified, leaving Bitcoin vulnerable to sharp but short-lived price swings. Want more token insights like this? Sign up for Editor Harsh Notariya’s Daily Crypto Newsletter here. Bitcoin STH/LTH Supply Ratio. Source: Glassnode According to the Supply Quantiles Cost Basis model, Bitcoin has rebounded from the 75th percentile cost basis near $100,000 and is consolidating around $106,200. This area reflects a critical psychological and technical zone for traders, marking a temporary stabilization following weeks of selling pressure. The next resistance lies at the 85th percentile cost basis of $108,500, which has historically capped recovery attempts during similar phases. The model’s data suggests Bitcoin’s upside may remain limited in the short term. Bitcoin Supply Quantiles Cost Basis Model. Source: Glassnode BTC Price Breakout Awaited Bitcoin’s price is currently at $103,922, struggling to overcome the downtrend that has been active for nearly two and a half weeks. The cryptocurrency has failed twice to breach this resistance, reinforcing the strength of bearish market sentiment. At present, Bitcoin trades below $105,000 but remains above the $101,477 support zone. This area is likely to form a consolidation base amid persistent volatility and cautious investor behavior. Bitcoin Price Analysis. Source: TradingView If bullish momentum strengthens, Bitcoin could break past $105,000 and challenge resistance near $108,000. Successfully flipping this level would mark the first significant recovery since October, signaling renewed optimism across the broader crypto market. The post Bitcoin Is Now Facing “Historical Recovery Barrier” Amid Heightened Market Churn appeared first on BeInCrypto.

Related Articles & Analysis
Why Is Crypto Down Today? – November 12, 2025
CryptoNews.com
Bitcoin’s $107K–$118K Wall: Why Bullish News Isn’t Enough to Break Through
CryptoPotato

Bitcoin Climbs Above $115,000 on US-China Trade Deal Optimism
The Defiant
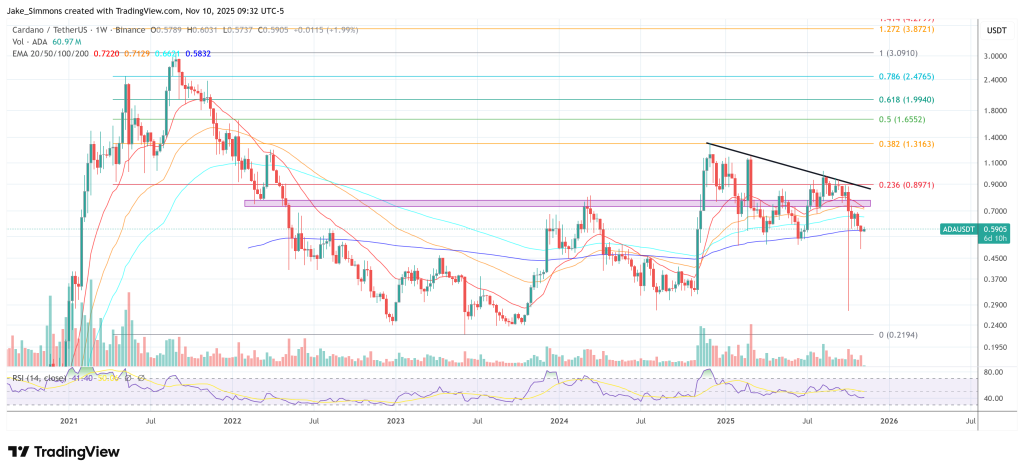
RealFi Will Turn Cardano Into A $1 Billion DeFi Powerhouse By 2026: Hoskinson
BitCoinist

7-Year Death Cross Pattern Shows Bitcoin Likely to Bottom at $95K Then Shoot to $145K
CryptoNews.com

Bitcoin Price Watch: Traders Eye $106K Ceiling in Volatile Push
BitRSS