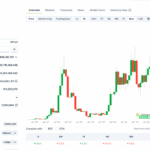
Ethereum price failed to recover further above $3,650. ETH is trimming gains and might decline further if it dips below the $3,360 support. Ethereum started a fresh decline after it failed to stay above $3,620. The price is trading below $3,550 and the 100-hourly Simple Moving Average. There was a break below a bullish trend line with support at $3,575 on the hourly chart of ETH/USD (data feed via Kraken). The pair could continue to move down if it settles below the $3,360 zone. Ethereum Price Dips Again Ethereum price started a recovery wave above $3,400 and $3,550, like Bitcoin. ETH price was able to climb above the $3,600 and $3,620 resistance levels. However, the bears remained active near the $3,650 zone. A high was formed at $3,658 and the price started a downside correction. There was a move below the $3,550 level. There was a break below a bullish trend line with support at $3,575 on the hourly chart of ETH/USD. The price tested the 50% Fib retracement level of the upward move from the $3,178 swing low to the $3,658 high. Ethereum price is now trading below $3,550 and the 100-hourly Simple Moving Average. If there is another recovery wave, the price could face resistance near the $3,500 level. The next key resistance is near the $3,520 level. The first major resistance is near the $3,550 level. A clear move above the $3,550 resistance might send the price toward the $3,650 resistance. An upside break above the $3,650 region might call for more gains in the coming days. In the stated case, Ether could rise toward the $3,800 resistance zone or even $3,880 in the near term. Another Decline In ETH? If Ethereum fails to clear the $3,550 resistance, it could start a fresh decline. Initial support on the downside is near the $3,420 level. The first major support sits near the $3,360 zone and the 61.8% Fib retracement level of the upward move from the $3,178 swing low to the $3,658 high. A clear move below the $3,360 support might push the price toward the $3,290 support. Any more losses might send the price toward the $3,220 region in the near term. The next key support sits at $3,175 and $3,150. Technical Indicators Hourly MACD – The MACD for ETH/USD is gaining momentum in the bearish zone. Hourly RSI – The RSI for ETH/USD is now below the 50 zone. Major Support Level – $3,360 Major Resistance Level – $3,550

Related Articles & Analysis
TradFi Solana ETF Frenzy Continues: What Does Wall Street Know That You Don’t
99bitcoins

Google’s Gemini AI Predicts the Price of XRP, PEPE, Ethereum by the End of 2025
CryptoNews.com
One Week After Staking ETFs, Solana Price Prediction is Weakening: Will $150 Hold?
99bitcoins
Crypto News Today: ETH And BTC Continue To Consolidate Despite Institutional Buying
99bitcoins
Crypto News Today, November 11 – Bitcoin Price USD Holds $105K as Traders Await Monad Launch and UNI Surges 50%: Best New Presale to Buy?
99bitcoins

ETH Déjà Vu? 2025 Crash Mirrors 2020 Drop — What’s Next for Ethereum’s Price?
CryptoPotato