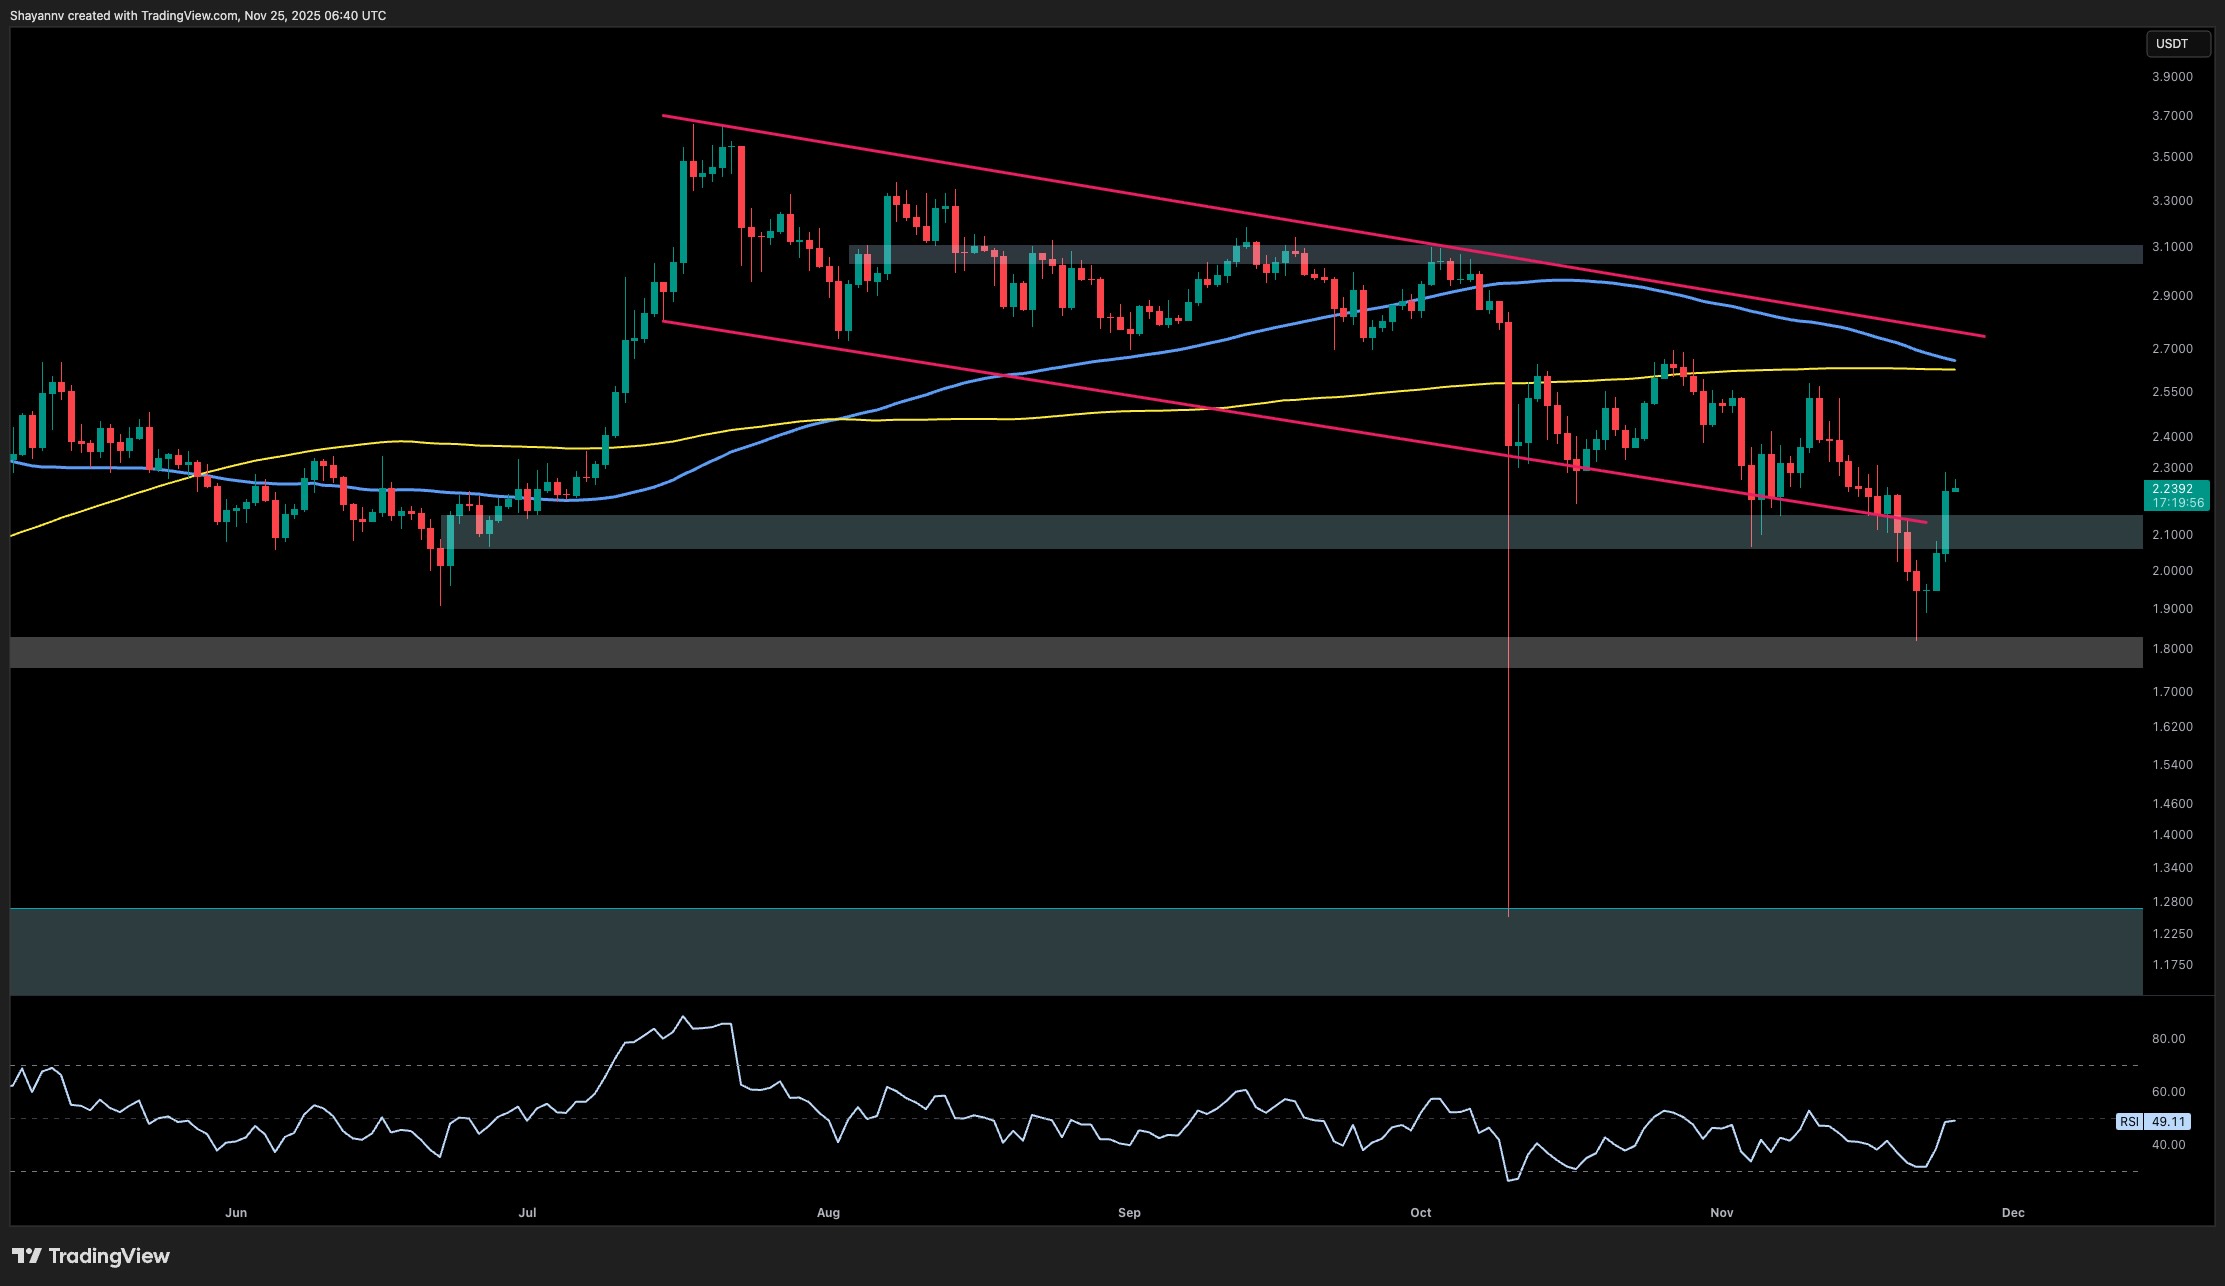
Ripple’s XRP has printed its first meaningful relief bounce after a prolonged selloff, reclaiming the $2.10–$2.20 zone. Despite the short-term strength, the broader structure remains intact on the downside, and the reaction from the current resistance cluster will determine whether this move is merely a corrective retracement or the beginning of a deeper recovery. XRP Price Analysis By Shayan The Daily Chart The daily timeframe shows XRP rebounding firmly from the $1.90 demand block, a level that has acted as multi-month structural support. The move higher has now carried the price back into the multi-month flag pattern, indicating a bear trap. This bounce is the first clean retest of the broken lower boundary of the flag. Historically, these retests often serve as decision points before continuation. Unless the asset can reclaim the $2.40–$2.50 region, the broader trend remains bearish, as this zone contains both a major order block and the region where multiple previous daily highs were swept before continuation to the downside. RSI shows modest bullish momentum, rising from oversold conditions toward mid-range, but has not yet broken its multi-week ceiling. This suggests that while downward exhaustion is present, momentum is not yet strong enough to confirm a macro reversal. A daily close above the $2.45 pivot would be the first indication of a structural shift. Failure to break through would keep downside targets open toward $1.80 and potentially the deeper demand zone around $1.60 should the broader market weaken again. The 4-Hour Chart The 4-hour timeframe highlights a sharp V-shaped rebound, driven initially by short-covering in the $1.95 region. The asset has now reached the confluence of the descending trendline and the red supply block at $2.30–$2.40, where early signs of exhaustion are visible. RSI is hovering near 70, approaching intraday overbought levels while facing the most significant resistance of the past month. This increases the probability of a short-term pullback into the $2.15–$2.20 area, which has flipped into a temporary support level. The main factor to watch is whether XRP can break and consolidate above the descending trendline. If this occurs, the next liquidity pockets sit around $2.55 and $2.75. Otherwise, rejection from here would raise the likelihood of another sweep of the $2.00 region before any larger recovery attempt. Overall, the 4-hour market structure remains bearish until XRP closes decisively above the $2.40–$2.50 region. The post Ripple Price Analysis: Has XRP Turned Bullish After Surge to Crucial Zone? appeared first on CryptoPotato.
Related Articles & Analysis

Best Crypto to Buy Now 26 November – XRP, Hyperliquid, Monad
CryptoNews.com

China’s Alibaba AI Predicts the Price of XRP, Cardano, Dogecoin by the End of 2025
CryptoNews.com

XRP Price Still Holds Its Green, But One Group Is Slowly Turning Into a Red Flag
BeInCrypto

XRP Breakout Loading? All Eyes on the Crucial $2.60 Level
CryptoPotato
[LIVE] Crypto News Today, November 26 – Bitcoin Price Holds $87K as Monad (MON) Lands on Polymarket: Best New Crypto to Buy?
99bitcoins

Grayscale Targets First U.S. Zcash ETF as Privacy Coin Explodes 1,000% – What’s Next?
CryptoNews.com