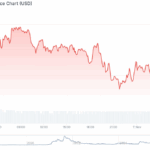
XRP price started a decent increase above $2.350. The price is now consolidating and might aim for more gains above the $2.50 level. XRP price stayed above $2.120 and started a recovery wave. The price is now trading above $2.35 and the 100-hourly Simple Moving Average. There was a break above a key contracting triangle with resistance at $2.33 on the hourly chart of the XRP/USD pair (data source from Kraken). The pair could continue to move up if it clears $2.50. XRP Price Starts Recovery XRP price started a recovery wave above $2.20 and $2.250, like Bitcoin and Ethereum. The price gained pace for a clear move above the $2.35 resistance. There was a break above a key contracting triangle with resistance at $2.33 on the hourly chart of the XRP/USD pair. The pair even surpassed the $2.420 barrier. A high was formed at $2.478 and the price started a consolidation phase above the 23.6% Fib retracement level of the upward move from the $2.240 swing low to the $2.478 high. The price is now trading above $2.40 and the 100-hourly Simple Moving Average. The bulls are now active near $2.450. If there is a fresh upward move, the price might face resistance near the $2.480 level. The first major resistance is near the $2.50 level, above which the price could rise and test $2.550. A clear move above the $2.550 resistance might send the price toward the $2.650 resistance. Any more gains might send the price toward the $2.720 resistance. The next major hurdle for the bulls might be near $2.750. Another Decline? If XRP fails to clear the $2.50 resistance zone, it could start a fresh decline. Initial support on the downside is near the $2.420 level. The next major support is near the $2.3550 level or the 50% Fib retracement level of the upward move from the $2.240 swing low to the $2.478 high. If there is a downside break and a close below the $2.3550 level, the price might continue to decline toward $2.30. The next major support sits near the $2.250 zone, below which the price could continue lower toward $2.120. Technical Indicators Hourly MACD – The MACD for XRP/USD is now gaining pace in the bullish zone. Hourly RSI (Relative Strength Index) – The RSI for XRP/USD is now above the 50 level. Major Support Levels – $2.420 and $2.3550. Major Resistance Levels – $2.480 and $2.50.

Related Articles & Analysis

Bitcoin Scrambles to Close October in Green as 2018 Sell-Off Shadows Loom
The Defiant

ETF Greenlight? Government Shutdown Deal Could Trigger Massive XRP Rally
BeInCrypto

Get Ready — The End Of November Will Be Massive For XRP, CEO Says
BitRSS

Filecoin (FIL) Skyrockets by 50% in a Day, Bitcoin (BTC) Back to $102K: Weekend Watch
CryptoPotato

BTC Slides Below $100K, Balancer Exploited for $128M, Ripple’s Big Announcements: Weekly Crypto Recap
CryptoPotato

Cardano Holds $0.52 as Midnight Passes 1M Mining Addresses — Is a Trend Shift Coming?
99bitcoins
